
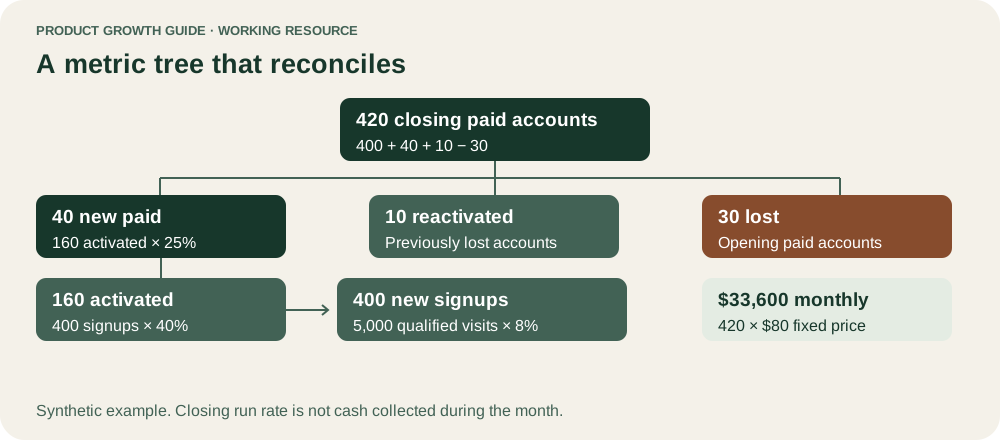
A useful product growth model explains how people become successful customers, how those customers remain successful, and how that behavior supports the business. Start with one customer segment and one measurable outcome. Connect acquisition, activation, retention, and monetization using explicit definitions and a shared time horizon. Then use the model to choose a test, rather than merely to explain a revenue target.
The first version can fit on one page. Its value comes from making disagreements visible: whether a signup is a customer, whether an invitation represents demand, and whether an apparent retention improvement is simply a change in the people arriving.
Begin with the unit that receives value
Choose whether the model follows a person, workspace, company, household, or transaction. A collaboration product may have ten active people in one paying workspace. Multiplying people by a workspace subscription price would overstate revenue. Conversely, an account-level model can conceal a declining number of successful people within an apparently retained company.
Write a sentence describing the customer outcome without mentioning your interface. For a scheduling product, that might be “a coordinator fills a recurring shift without contacting each worker individually.” The corresponding event should show that outcome happened. Creating an account or viewing a dashboard is usually an earlier step.
Specify the segment as well. A small restaurant and a national staffing organization may need the same basic outcome but have different setup, purchase, and support journeys. Combining them immediately makes your model harder to interpret.
Separate the stock from the flow
New customers are a flow during a period. Active customers are a stock measured at a point or across a defined interval. Revenue combines different flows and stocks depending on how billing works. Keep those meanings explicit.
For a fixed monthly account subscription, a simple closing-customer equation is:
Closing paid accounts = opening paid accounts + new paid accounts + reactivated accounts − lost paid accounts.
Expansion belongs in a revenue equation, not automatically in the account count. If an existing customer buys ten additional seats, the business has more revenue but not ten new customer accounts. A usage-based business also needs a model of billable consumption and realized price, so the fixed-subscription equation will not be sufficient.
Next, connect new demand to new successful customers. You can start with qualified visits multiplied by signup rate, then activation rate among signups, then payment rate among activated accounts. These are conditional transitions. Do not multiply rates with incompatible denominators or observation windows.
Give each arrow a contract
For every transition, record the eligibility rule, event, time window, and owner. “Activation” without these details invites competing interpretations. The owner maintains the definition and investigates changes; ownership does not imply that one department can improve the transition alone.
| Transition | Example definition | Common ambiguity |
|---|---|---|
| Visit to signup | New eligible accounts within seven days of a qualified visit | Several people belong to one account |
| Signup to value | Account fills its first real shift within 14 days | Demo data produces false success |
| Value to paid | Activated account starts a paid subscription within 30 days | Trials and paid starts are mixed |
| Paid to retained | Account remains paid and fills a real shift next month | Billing retention hides inactivity |
Build a second layer only when the first layer reconciles. Acquisition channels, team invitations, and expansion mechanisms may explain a transition. They should not obscure basic accounting.
Worked example: a synthetic scheduling product
These numbers illustrate a model, not a benchmark or a forecast. A fictional product begins a month with 400 paid accounts. It receives 5,000 qualified visits, of which 8% produce an account signup. Of those 400 accounts, 40% fill a real shift, and 25% of the 160 activated accounts become paid within the model’s chosen observation window. The new-account path therefore produces 40 paid accounts. For this synthetic example, all transitions occur within the month. A real 30-day conversion window can cross month boundaries and needs explicit cohort timing.
Suppose ten previously lost accounts reactivate and 30 opening accounts cancel. Closing paid accounts equal 400 + 40 + 10 − 30 = 420. At an unchanged $80 monthly price, closing recurring revenue would be $33,600. That is a month-end run rate, not the cash collected during the month.
Now compare three possible changes while holding everything else constant:
| Hypothetical change | Additional paid accounts in this simplified model | What must be checked |
|---|---|---|
| Qualified visits rise from 5,000 to 6,000 | 8 | New traffic has comparable intent |
| Activation rises from 40% to 50% | 10 | More accounts achieve real value |
| Lost accounts fall from 30 to 20 | 10 | Cancellation is delayed, not prevented |
These comparisons identify sensitivity, not causality. Activation might be difficult to move. Acquisition may be cheap or expensive. Saving an account for one month does not establish durable retention. The useful next question is which change the team can plausibly produce at acceptable cost.
Add feedback when it actually exists
Balfour’s Universal Growth Loop describes reinforcing connections between growth, resources, and new opportunities. At the product level, a model becomes more informative when customer behavior creates future demand, supply, or expansion. For example, a coordinator may invite workers who later introduce the product to another coordinator. Track that complete chain. An invitation that never becomes an independent successful account is not yet evidence of an acquisition mechanism.
Brian Balfour’s Four Fits framework emphasizes that product, market, channel, and business model need to work together. This is a useful check on a spreadsheet that assumes any channel can supply equally valuable customers at any price. Our practical extension is to write the acquisition assumptions beside each transition and test their compatibility before scaling.
For deeper study on the fit between channel economics and a growth model, Balfour’s own framework essays are a relevant expert resource. Start with the channel-model discussion if your immediate decision concerns whether a higher-touch acquisition motion fits your revenue per account.
Printable model worksheet
Complete this table in a working session with product, data, marketing, and commercial colleagues. Use an actual date range and write “unknown” where you need evidence.
| Model field | Your answer | Evidence or next check |
|---|---|---|
| Customer unit and segment | __________ | __________ |
| Customer outcome and event | __________ | __________ |
| Observation period | __________ | __________ |
| Opening active and paid population | __________ | __________ |
| New eligible demand | __________ | __________ |
| Signup, activation, and payment denominators | __________ | __________ |
| Retained, lost, and reactivated accounts | __________ | __________ |
| Expansion and contraction revenue | __________ | __________ |
| Most sensitive plausible lever | __________ | __________ |
| Intervention, owner, and decision date | __________ | __________ |
Make the model a decision routine
Reconcile the model with actual account and revenue records before using it in planning. A mismatch often reveals duplicate identities, a date-window problem, or an unmodeled path such as a sales-assisted purchase. Add that path explicitly instead of forcing it into a convenient conversion rate.
At each review, separate what changed from why it changed. Update measured inputs first. Then discuss explanations and decide what evidence would distinguish them. Keep a short change log so that an improved number is not confused with a revised definition.
For a new initiative, identify the arrow it should affect, its expected mechanism, and its downstream consequences. “Improve onboarding” is too broad. “Help eligible coordinators import a real roster so they can fill their first shift” is testable. The model becomes useful when it constrains what the team builds.
Where this model stops
A simple model cannot fully represent seasonality, heterogeneous customer needs, long sales cycles, or interactions among interventions. A single average price also conceals discounts and expansion. Add detail where it changes a decision, and preserve the simpler view for communication.
Most importantly, a model describes assumptions and observed relationships. It does not prove that increasing one input will mechanically produce the calculated output. Use sensitivity analysis to select promising questions, customer research to understand mechanisms, and suitable experiments to test changes. The model earns its place when the team can explain its next bet and recognize evidence that would overturn it.
Sources
Something we should correct?
Tell the editors ↗