
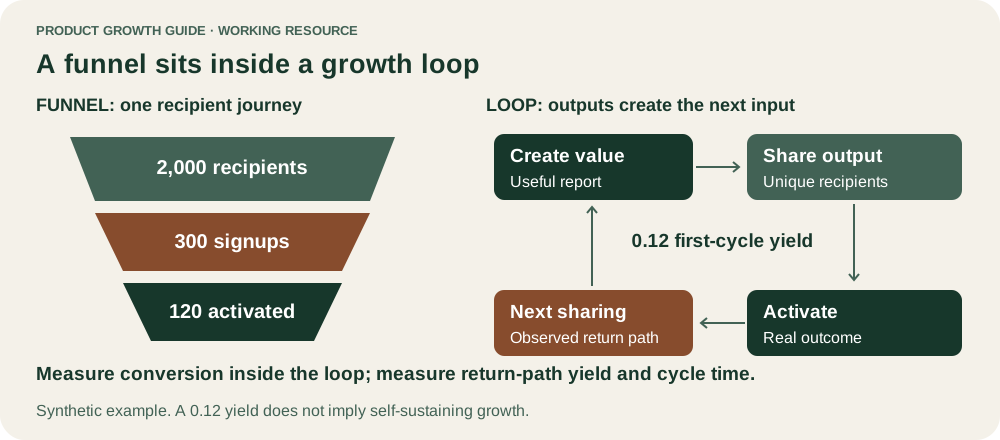
Use a funnel when you need to understand conversion through a defined sequence. Use a growth loop when you need to understand how an output of customer or business activity becomes an input to another cycle. Most products benefit from both: the funnel reveals where a journey loses people, while the loop tests whether the system produces future demand, supply, or resources.
A circular diagram is not evidence of compounding. Identify the return path, measure its yield and timing, and distinguish generated growth from people who would have arrived anyway.
Begin with the question the diagram must answer
A funnel answers questions such as: How many eligible visitors sign up? How many new accounts complete a real task? Where do customers abandon checkout? It needs event definitions, an eligibility population, and a conversion window.
A loop answers a different question: What does successful use produce that can generate another successful user, valuable contribution, or resource? A shared artifact could attract new users. New participants could create content that helps future participants. Revenue could fund further acquisition. Each mechanism needs an explicit connection between output and next input.
Brian Balfour’s discussion of launching for growth emphasizes sustainable mechanisms rather than treating a launch as the whole growth strategy. His Universal Growth Loop describes reinforcement between growth, resources, and new opportunities. Our task-level method below applies that systems perspective to a specific measurable return path.
Build the funnel with conditional transitions
Choose a customer unit and a window. For example, follow new workspaces from qualified visit to signup, completed project, and paid purchase over 30 days. The conversion rate at each step should use the population eligible for that step.
A funnel can be strict or allow variations in order, depending on the customer journey. Decide whether repeated events, returning accounts, and sales-assisted purchases belong in the same analysis. Document that choice rather than letting the analytics tool decide silently.
Funnel analysis is useful even in a loop-driven product. If referred users arrive but do not activate, the return path may generate traffic without generating durable growth. The funnel helps diagnose that loss.
Prove the loop closes
Write every step in verbs. “A customer creates a report; shares it with a relevant colleague; the colleague sees a reason to use the product; creates an eligible account; completes a real report; shares again.” The last action must connect to the beginning of another cycle.
Identify the incentive for each participant. Why would a customer share? Why would the recipient care? If the only answer is “we will ask them,” the mechanism may not match the customer job. Forced invitations can increase output while degrading trust or the quality of arrivals.
Also identify who does the work. A loop that depends on employees manually creating and distributing every artifact has different economics from one supported by ordinary customer use. Neither is inherently invalid, but the model should show the resource dependency.
Worked example: a synthetic collaboration loop
A fictional planning product has 1,000 newly activated accounts. Each shares an average of two project links with unique relevant recipients during its first month. Assume, for illustration, that 15% of recipients create an eligible account and 40% of those accounts activate. All counts are invented.
The simplified first-cycle yield is:
1,000 activated accounts × 2 recipients × 15% signup × 40% activation = 120 newly activated accounts.
The return-path yield is 0.12 activated accounts per original activated account. This does not imply self-sustaining growth. It describes one modeled acquisition contribution before accounting for duplication, overlap, or recipients who would have joined independently.
| Return-path stage | Synthetic population | Relevant question |
|---|---|---|
| Activated sharers | 1,000 | How many actually create useful shareable work? |
| Unique relevant recipients | 2,000 | Are recipients new and deduplicated? |
| Eligible signup accounts | 300 | Did sharing create incremental demand? |
| Activated new accounts | 120 | Do they achieve real value? |
| Next-cycle sharers | Not yet observed | Do they repeat the mechanism? |
If the next generation behaves similarly, it might create roughly 14 additional activated accounts in another cycle under the same assumptions. That is an illustrative multiplication, not a forecast. Real cohorts may have different networks, motivations, and overlap.
The team should not claim that the loop compounds indefinitely. The useful question is whether improving artifact value, recipient understanding, or activation can create a meaningful and economically worthwhile contribution.
Include cycle time and saturation
Two mechanisms with the same yield can grow at different speeds if one cycles in a day and the other in three months. Record the elapsed time from input to output and then to the next completed cycle. Long lags can conceal whether the mechanism works at all.
Networks also overlap. A customer may invite the same people repeatedly, and later generations may have fewer new contacts. Content can saturate a topic. Paid acquisition can face rising costs. Model the plausible saturation or resource constraints instead of extrapolating a constant rate forever.
Track quality as well as quantity. A shared artifact that attracts many low-fit accounts may reduce activation and increase support load. A loop should produce an input that can become another valuable output, not merely a bigger event count.
Choose the right view for the next decision
| Your immediate question | Best starting view | Add this complementary check |
|---|---|---|
| Why are eligible signups failing setup? | Funnel | Downstream recurring value |
| Does sharing create new successful accounts? | Loop | Recipient activation funnel |
| Does content create durable acquisition? | Loop | Traffic quality and conversion |
| Where do purchases abandon? | Funnel | Retained paid use after purchase |
| Can revenue fund further acquisition? | Loop | Real costs, timing, and capacity |
The choice is about explanatory usefulness. There is no need to replace every funnel with a loop or to force every product into a viral acquisition story.
Printable loop-or-funnel worksheet
| Field | Your working model |
|---|---|
| Decision this model supports | __________ |
| Customer or business unit | __________ |
| Input and eligible population | __________ |
| Sequence of customer actions | __________ |
| Valuable output | __________ |
| Explicit return path to new input | __________ |
| Participant incentive at each step | __________ |
| Yield after deduplication | __________ |
| Time to complete one cycle | __________ |
| Cost, capacity, and saturation limit | __________ |
| Funnel transition most likely to constrain yield | __________ |
| Evidence of incrementality | __________ |
| Next intervention and review date | __________ |
Test the mechanism rather than the picture
Instrument the return path so that you can link an output to a recipient and a resulting account where appropriate and privacy-respecting. Distinguish anonymous exposure, identified signup, and completed value. Avoid implying certainty where tracking cannot establish the connection.
When feasible, test a sharing improvement among eligible accounts using an appropriate assignment unit. Measure incremental successful arrivals and outcomes for existing users. A bigger share button may increase link sends without improving recipient quality or customer success.
For content or paid reinvestment mechanisms, attribution alone may be insufficient to establish incrementality. Use a suitable comparison or holdout when practical, and state uncertainty when it is not. Revenue should not be treated as an unlimited acquisition budget without considering service costs, collections, and operating obligations.
Limits of the two views
Funnels simplify journeys that can branch, pause, repeat, or involve several people. Loops simplify feedback systems that can overlap or reverse. Both can omit market conditions and resource limits.
Keep the diagram only as detailed as the decision requires, and preserve the measurable contracts behind it. A useful funnel tells the team where to investigate. A useful loop explains where the next cycle might come from and what could prevent it. Together they make a growth model more testable.
Sources
Something we should correct?
Tell the editors ↗